Note
Go to the end to download the full example code.
Load Surface from XYZ File
Load a surface from a file of XYZ coordinates
import numpy as np
import omf

# sphinx_gallery_thumbnail_number = 2
import pandas as pd
import pyvista as pv

import omfvista
base_quaternary_df = pd.read_csv("../assets/mod_base_quaternary_300_nan.txt")
print(base_quaternary_df.head())
             x             y   z
0  633025.9964  5.821552e+06 NaN
1  633325.9964  5.821552e+06 NaN
2  633625.9964  5.821552e+06 NaN
3  633925.9964  5.821552e+06 NaN
4  634225.9964  5.821552e+06 NaN
Create a pyvista dataset out of the coordinates
x = base_quaternary_df["x"].values
y = base_quaternary_df["y"].values
z = np.zeros_like(x)
# simply pass the numpy points to the PolyData constructor
cloud = pv.PolyData(np.c_[x, y, z])
# Add data values onto the mesh nodes
cloud["my data"] = base_quaternary_df["z"].values
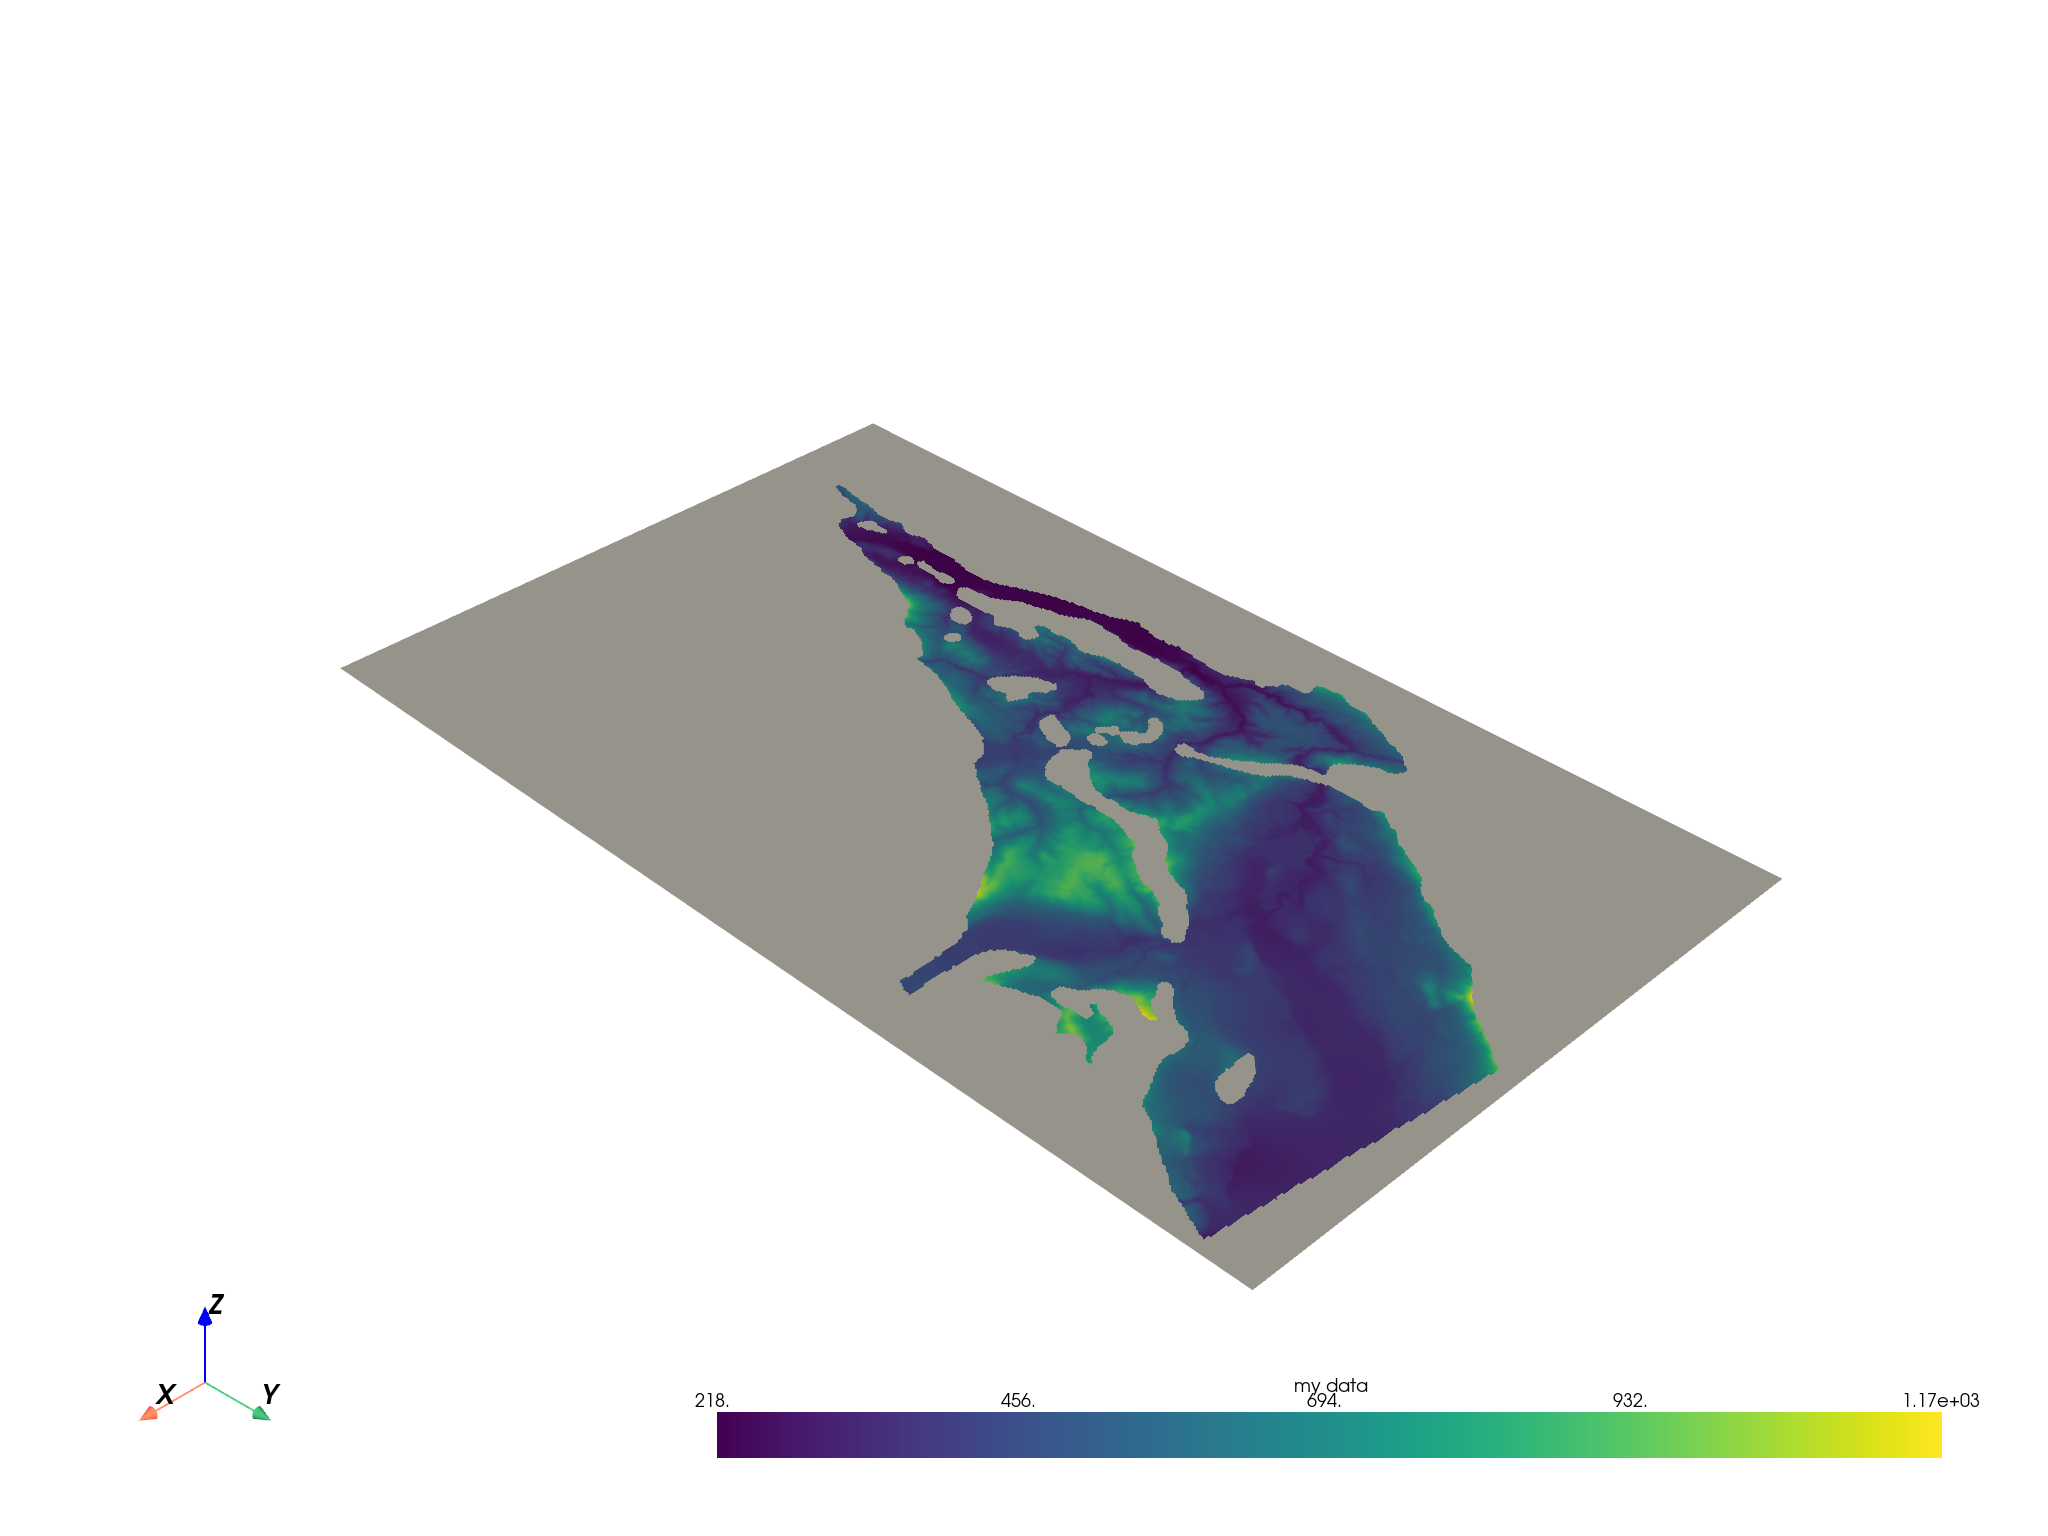
Make a surface using the delaunay filter
surf = cloud.delaunay_2d()
surf.plot()

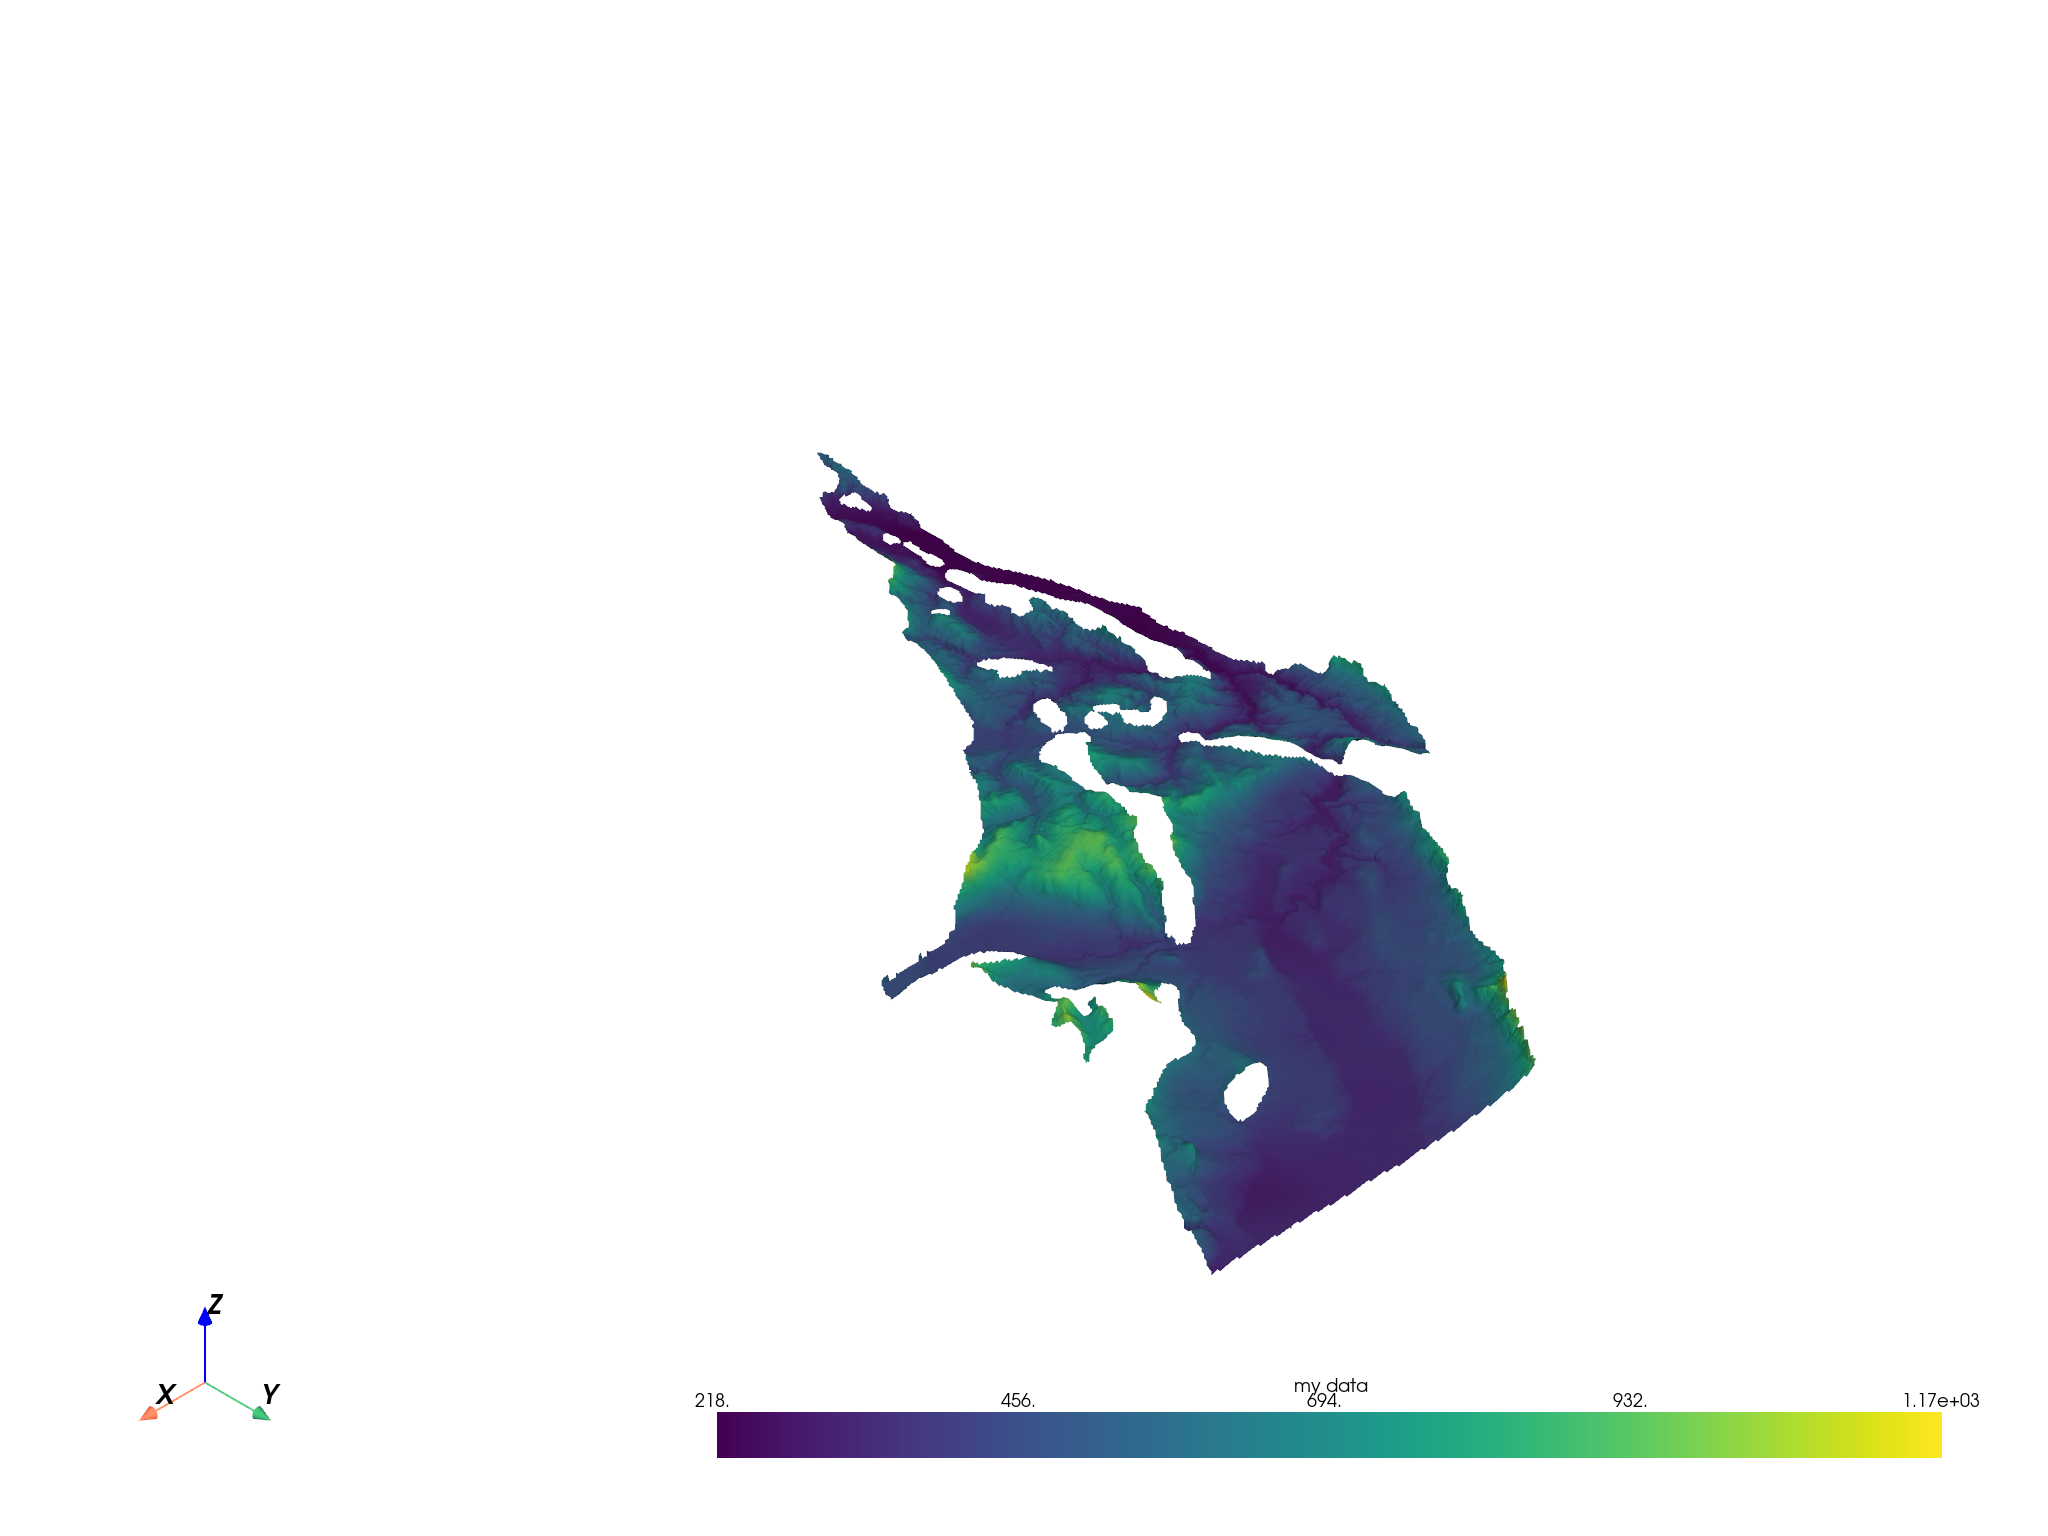
Now warp by a scalar to have a more realistic surface Note the scaling factor that exagerates the surface
warped = surf.warp_by_scalar(factor=5.0)
warped.plot()

Create an OMF element that can be saved out
tris = warped.faces.reshape(surf.n_cells, 4)[:, 1:4]
base_quaternary_omf = omf.SurfaceElement(
    name="My Surface",
    description='This is a decription of "My Surface"',
    geometry=omf.SurfaceGeometry(vertices=warped.points, triangles=tris),
    data=[
        omf.ScalarData(
            name="My awesome data", array=np.array(surf["my data"]), location="vertices"
        ),
    ],
)
base_quaternary_omf.validate()
True
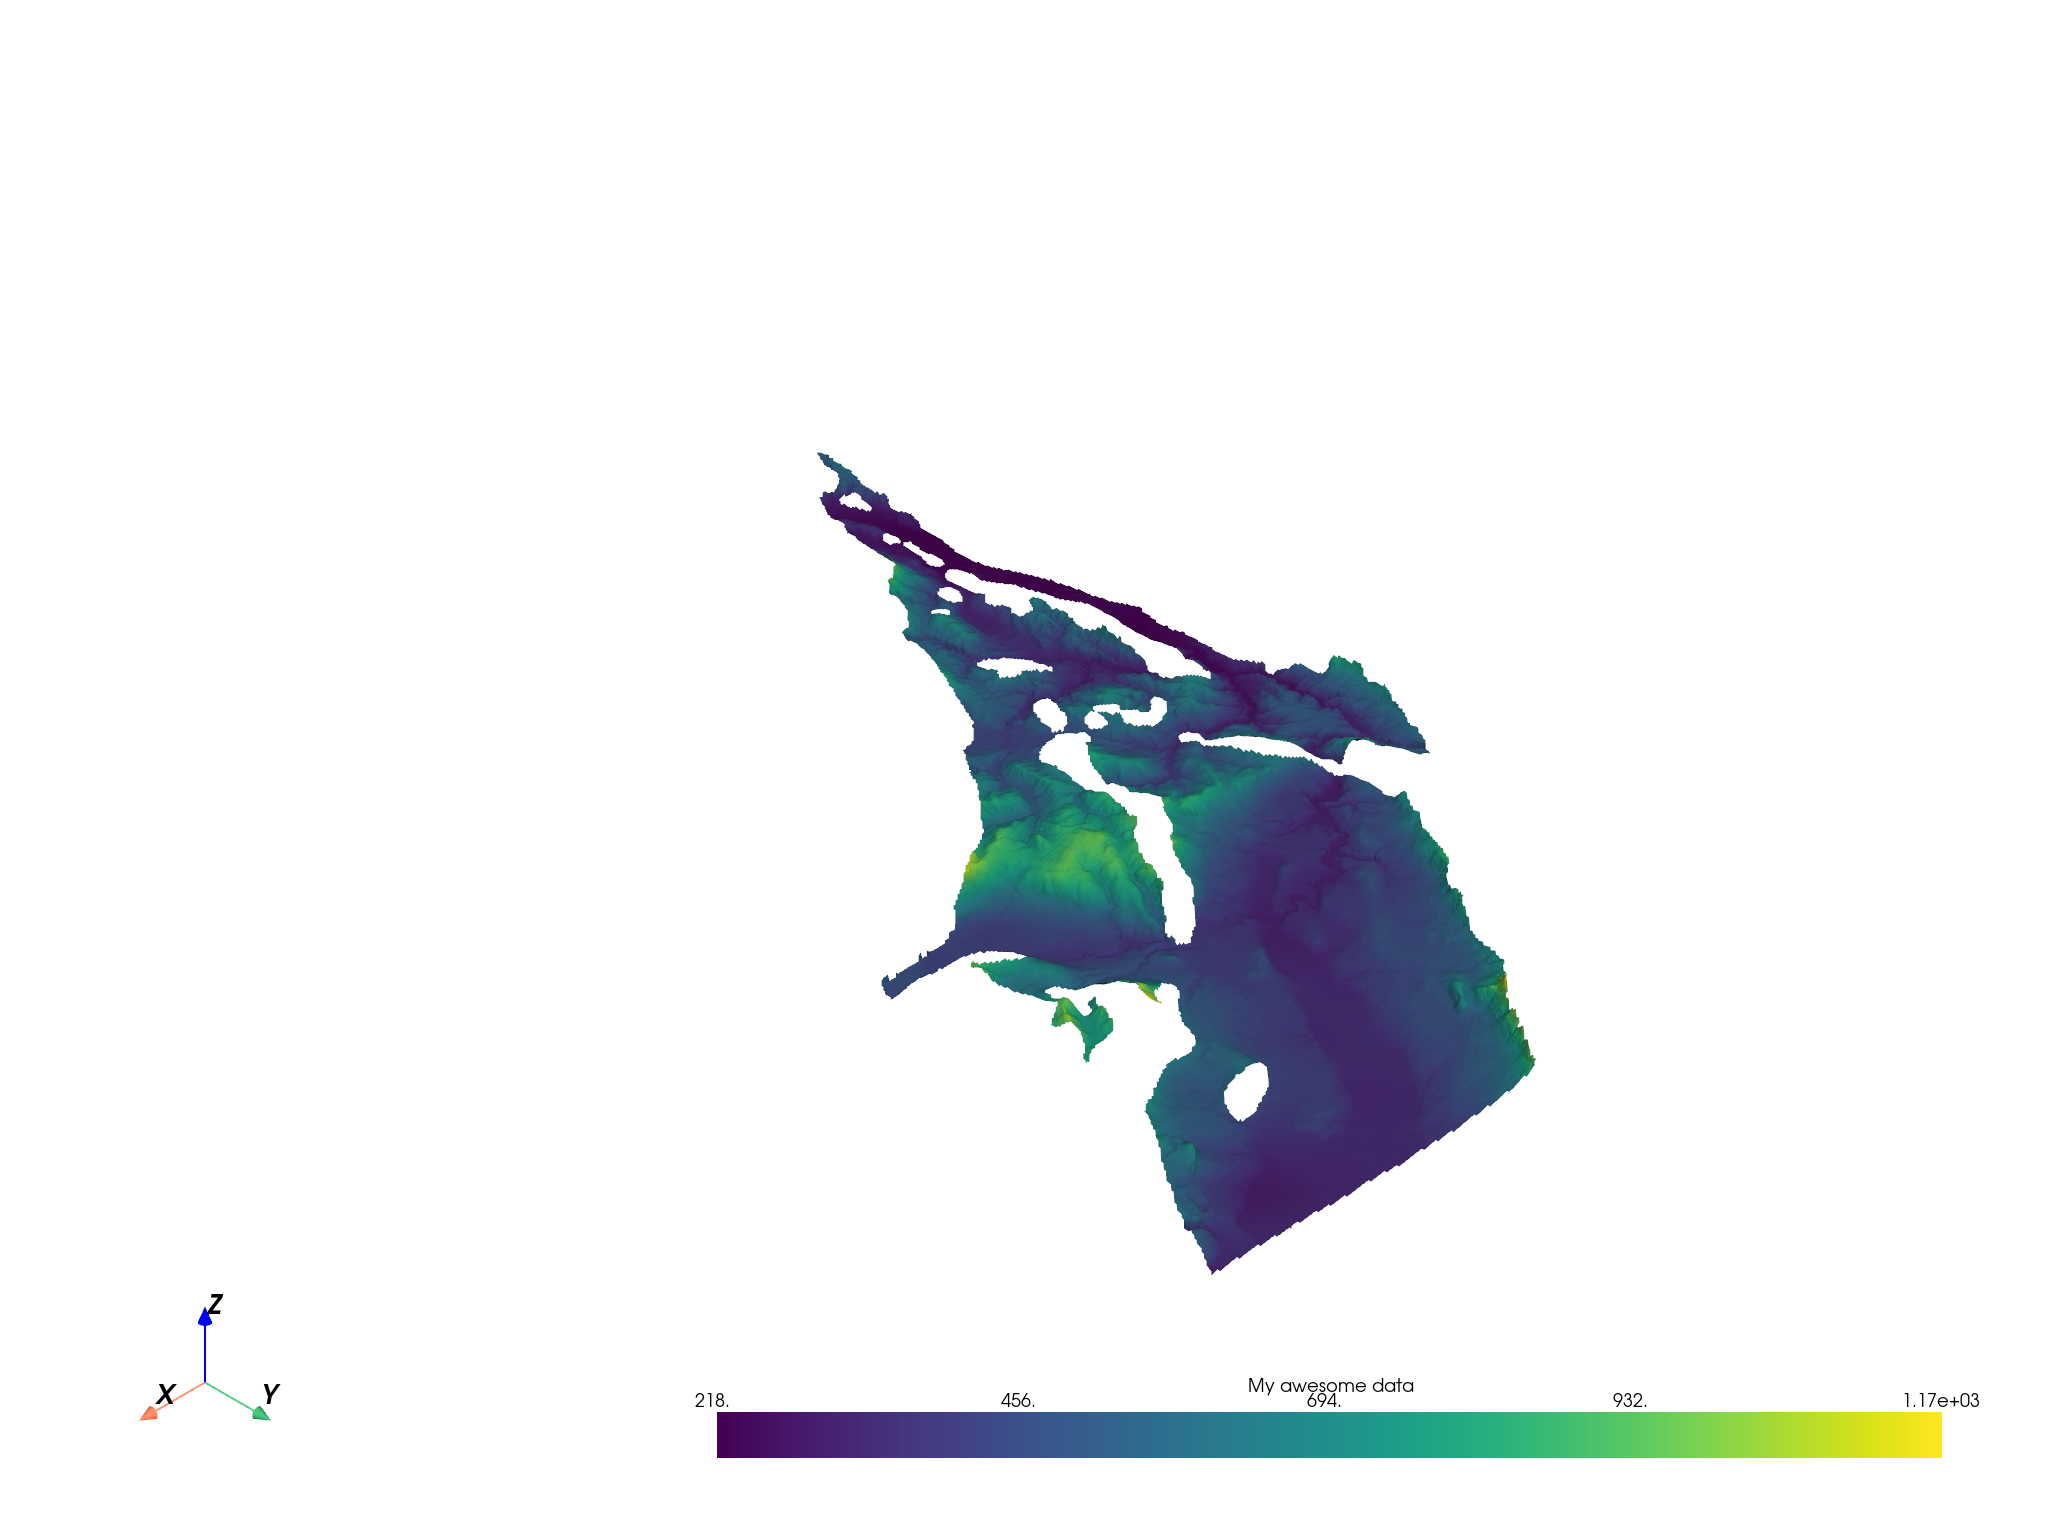
Sanity check
omfvista.wrap(base_quaternary_omf).plot()

Total running time of the script: (0 minutes 7.029 seconds)